From Blind Builds to Interactive Debugging
For years, CI pipelines have operated like sealed black boxes. You push code, the build runs somewhere in the cloud, and minutes later you get a verdict: green or red. Success or failure. Pass or fail.
When everything works, it feels seamless.
When it doesn’t, it feels like shouting into the void.
The traditional build pipeline was designed for automation, not conversation. It executes instructions deterministically, produces logs, and exits. If something goes wrong, you read the logs and try to interpret what happened inside an environment you cannot see.
But modern development has outgrown blind builds.
Today’s systems are distributed, containerized, environment-sensitive, and deeply interconnected. Logs alone are no longer enough. Developers need to step inside the runtime environment, inspect state, reproduce failures, and experiment live.
This is the shift from blind builds to interactive debugging — and it’s reshaping how modern teams work.
The Era of Blind Builds
In the early days of CI, the model was simple:
- Commit code
- Trigger build
- Run tests
- Produce logs
- Report status
This model worked because applications were simpler. Dependencies were fewer. Infrastructure was predictable.
But blind builds came with inherent limitations:
- You couldn’t inspect the environment directly
- You couldn’t modify anything mid-run
- You couldn’t test hypotheses interactively
- You relied entirely on logs
If a test failed, you read the output. If the logs were insufficient, you added more logging and pushed another commit. Then you waited.
That feedback loop might take minutes — or hours.
Multiply that across teams, and it becomes expensive.
Why Logs Alone Aren’t Enough
Logs tell a story. But they rarely tell the whole story.
Consider a few common scenarios:
- A dependency resolves to a slightly different version in CI
- An environment variable is missing
- A network call behaves differently in the runner
- A container image pulls an unexpected layer
- A race condition appears only under CI resource constraints
Logs might show the failure — but not the root cause.
Without direct access to:
- The filesystem
- Running processes
- Environment variables
- Installed packages
- Active network connections
You’re diagnosing symptoms, not investigating causes.
That’s where interactive debugging changes everything.
The Rise of Interactive CI Environments
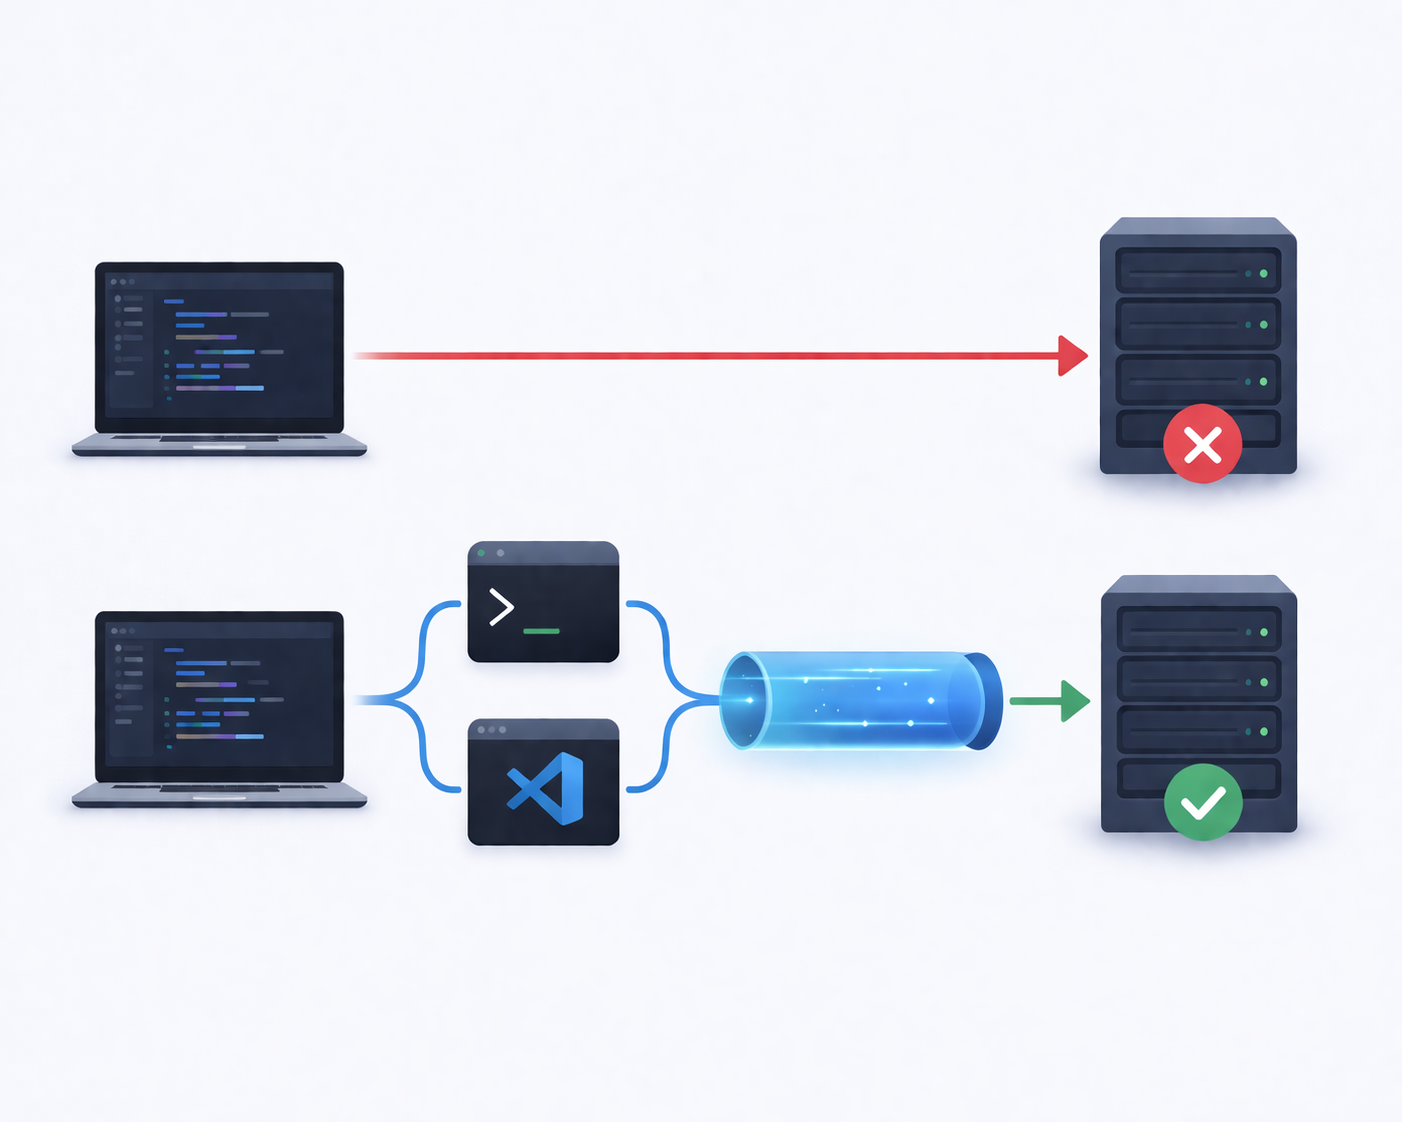
Interactive debugging inside CI means gaining real-time access to the running pipeline environment.
Instead of reading what happened, you step inside and see it.
This typically includes:
- A web-based terminal inside the CI runner
- A browser-accessible IDE (like VS Code)
- Secure tunnels exposing running services
- Temporary authenticated access
The CI job no longer feels like a remote machine you can’t touch. It becomes a temporary development server you can enter.
And that shift is profound.
What Interactive Debugging Actually Looks Like
Let’s imagine a test fails in your CI pipeline.
Instead of:
- Reading logs
- Guessing
- Committing changes
- Re-running the pipeline
You do this:
- Open a secure URL provided by the pipeline
- Access a live shell session in the runner
- Inspect environment variables
- Re-run the failing test manually
- Install debugging tools if needed
- Modify config files to test hypotheses
You experiment in real time.
You observe the exact environment where the failure occurred.
The difference in speed and clarity is dramatic.
From Automation-Only to Automation + Intervention
Traditional CI/CD philosophy emphasized full automation. And automation remains critical.
But full automation doesn’t eliminate the need for human insight.
Interactive debugging doesn’t replace CI automation — it augments it.
Automation handles:
- Repeatable builds
- Deterministic tests
- Deployment flows
Interactive access handles:
- Non-deterministic failures
- Environment discrepancies
- Edge-case debugging
- Exploratory troubleshooting
Think of it as adding a steering wheel to an automated car. It still drives itself — but when needed, you can take control.
Secure Tunnels: Breaking the Isolation Barrier
CI runners are typically isolated for good reasons:
- Security
- Ephemeral lifecycle
- Network protection
But isolation becomes a barrier when you need access.
Secure cloud tunnels solve this by:
- Creating temporary public URLs
- Encrypting traffic
- Enforcing authentication
- Expiring automatically
With a secure tunnel, you can expose:
- A web application running in CI
- A debugging interface
- A temporary API endpoint
You can even demo a feature directly from a CI job without deploying to staging.
It’s controlled exposure — not permanent infrastructure.
DevInCi works on GitHub Actions, GitLab CI, and locally — thanks to a platform abstraction layer. From scripts/lib/ci.sh:
# CI Platform Abstraction Layer
if [ -n "${GITHUB_ACTIONS:-}" ]; then
  CI_PLATFORM="github"
elif [ -n "${GITLAB_CI:-}" ]; then
  CI_PLATFORM="gitlab"
else
  CI_PLATFORM="local"
fi

# Normalized CI variables across platforms
case "$1" in
  github)
    CI_REPO="${GITHUB_REPOSITORY:-}"
    CI_COMMIT="${GITHUB_SHA:-}"
    ;;
  gitlab)
    CI_REPO="${CI_PROJECT_PATH:-}"
    CI_COMMIT="${CI_COMMIT_SHA:-}"
    ;;
esac
The same debugging workflow works regardless of which CI platform you use.
Browser-Based IDEs in CI
One of the most transformative aspects of interactive debugging is the ability to launch a browser-based IDE inside the pipeline.
Imagine opening VS Code in your browser, connected directly to:
- The CI filesystem
- The build artifacts
- The runtime environment
You can:
- Search code
- Inspect logs
- Edit configuration files
- Run shell commands
- Install debugging extensions
All inside the environment where the issue occurred.
There’s no “replicate locally” step. No guessing.
You’re working exactly where the failure happened.
How This Changes Team Collaboration
Interactive debugging isn’t just about individuals. It reshapes team workflows.
Shared Live Sessions
Developers and DevOps engineers can join the same CI environment:
- Inspect the same files
- Review the same logs
- Run commands together
Debugging becomes collaborative instead of asynchronous.
Faster Incident Resolution
When production pipelines fail, the ability to:
- Enter the failing environment
- Investigate live
- Identify misconfigurations
Reduces downtime and stress.
Instead of long Slack threads analyzing logs, teams work inside the environment.
Reducing the “Works on My Machine” Gap
The phrase “works on my machine” exists because environments differ.
Interactive CI debugging flips that dynamic.
Now the canonical environment is:
The CI runner.
Developers debug directly in it.
That reduces:
- Local vs CI discrepancies
- OS-level mismatches
- Dependency drift
- Hidden configuration differences
The environment becomes shared and authoritative.
When to Use Interactive Debugging
Not every build requires interactivity.
It’s most valuable when:
- CI-only failures are common
- The system is distributed or containerized
- Environment drift causes instability
- Pipelines are complex
- Debugging cycles are slow
If your builds are simple and stable, logs may suffice.
But in high-complexity systems, blind builds waste time.
Interactive debugging restores visibility.
Cultural Impact: Transparency Over Mystery
Blind builds create mystery. Interactive debugging creates transparency.
When engineers can inspect environments directly:
- Confidence increases
- Assumptions decrease
- Root causes are found faster
- Institutional knowledge grows
The pipeline stops being magical infrastructure.
It becomes an understandable, inspectable system.
And that transparency builds better engineering habits.
The Evolution of CI/CD
CI/CD has evolved in stages:
- Manual builds
- Automated builds
- Continuous delivery
- Infrastructure as code
- Ephemeral runners
- Interactive pipelines
Interactive debugging represents the next logical step.
Here's what this looks like with ASD DevInCi — a single action in your workflow:
-  uses: asd-engineering/asd-devinci@v1
  with:
    api-key: ${{ secrets.ASD_API_KEY }}
    interface: codeserver # Full VS Code in browser
    shell: bash
This gives you a full VS Code environment running inside the CI runner, accessible via a secure public URL.
As systems grow more complex, the tools we use must grow more transparent.
The future of CI isn’t just faster builds.
It’s smarter, more accessible environments.
Conclusion
The transition from blind builds to interactive debugging marks a turning point in modern software development.
For years, developers relied on logs to interpret failures inside inaccessible CI environments. That model worked — until complexity outpaced visibility.
Interactive debugging reintroduces control without sacrificing automation. It allows engineers to step inside CI runners, inspect live environments, and resolve issues faster and more collaboratively.
CI pipelines no longer have to be opaque execution engines.
They can become living, inspectable workspaces.
And once you experience that shift, going back to blind builds feels like debugging with the lights off.

Oleh Kokhan
I work at the intersection of technology, products, and people. As a marketer inside a technology-driven company, my role goes far beyond promotion or visibility. I focus on making complex technical products understandable, credible, and valuable to the right audiences — engineers, founders, platform teams, and decision-makers. I translate engineering reality into clear positioning, narratives, and market signals without oversimplifying or distorting the truth. My work starts from how the product actually functions: infrastructure, workflows, constraints, and real-world use cases — not from assumptions or buzzwords. I believe that strong marketing in a technical company is built on respect for the product, the engineers behind it, and the users who rely on it.